How can I navigate the commission widgets report overview page?
Introduction:
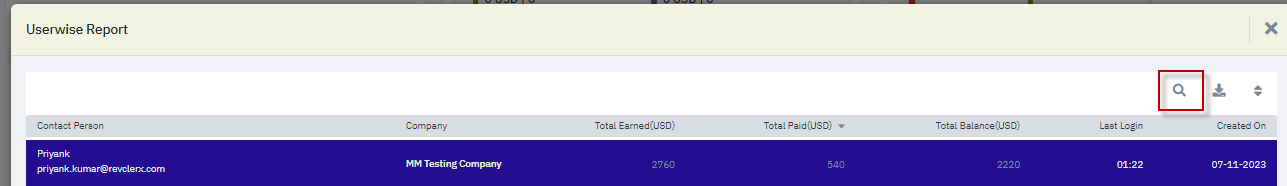
Commission Overview:
The widget consists of three key columns: Balance, Paid, and Earned.
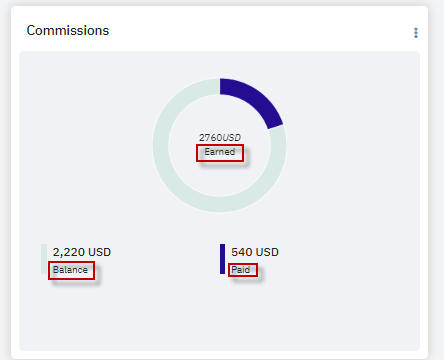
- The Earned amount is the sum of Balance and Paid
The report is user-wise, allowing for detailed insights into individual user commissions.
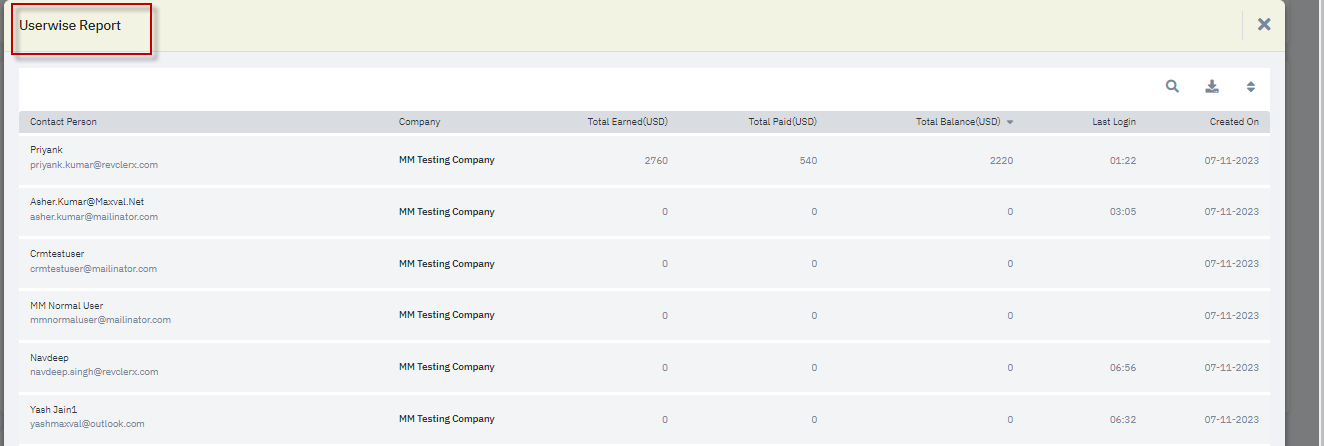
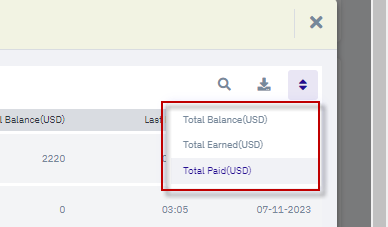
- Users can sort the report by Total Paid, Total Earned, and Total Balance for a clearer understanding.
Export Functionality:
The report supports exporting data to Excel for further analysis.
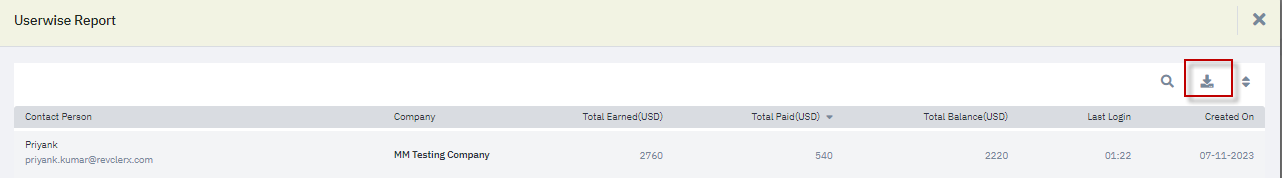
- Clicking on the "Export" button initiates the download of the report in the Commission Widgets section.
- Users can efficiently search for specific commission details using the search functionality.
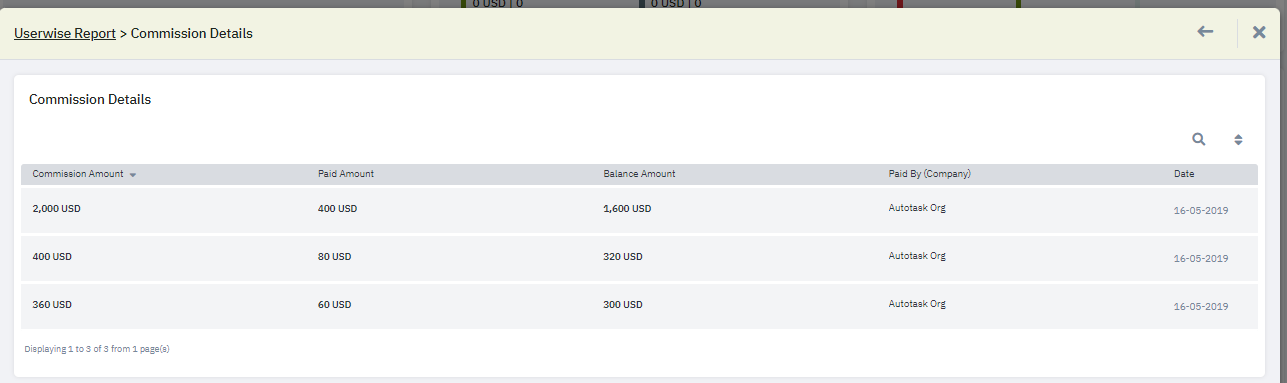
Detailed Commission Breakdown:
- Clicking on specific amounts, such as 16300 and 2020, allows users to view a detailed breakdown of paid and commission amounts.
- The report showcases the combination of amounts contributing to the total.
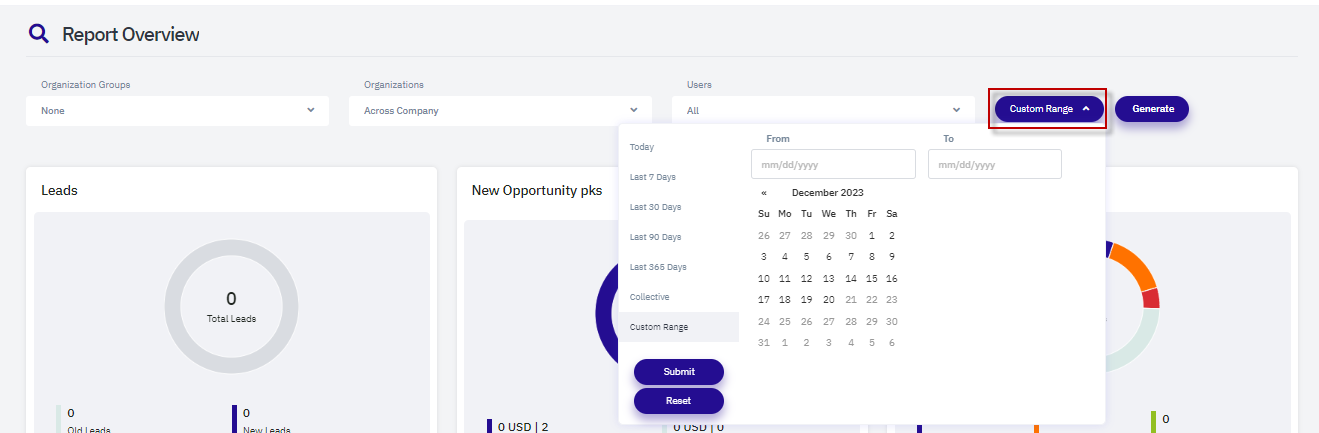
Users can filter reports based on organization groups, specific organizations, and users

Conclusion:
The Commission Widgets Report provides users with a versatile tool to analyze commission data effectively. Whether exploring user-wise details, date-wise reports, or custom date ranges, users can navigate the report overview page to gain valuable insights into their commission structure. The article concludes with a total commission amount of 2760 and extends gratitude to all users.
Related Articles
How to review the ROI Report?
Introduction: In this article, we will delve into the intricacies of the Partner Marketing ROI Report Page, a robust functionality designed to showcase the return on investment (ROI) from partner marketing initiatives. This feature empowers ...How do I view the Report for Blog template?
A new enhancement has been made to the Asset Report for blog posts, aimed at improving the reporting functionality and providing more detailed insights. The update introduces several changes to how blog posts are tracked and reported, offering users ...How do I view a social media drip report?
It is possible to personalize navigation menus within Mindmatrix software. If you are unable to navigate to the correct page, contact your platform administrator. Note: Social media reporting in one account cannot be viewed by other accounts. These ...How do I review the account overlap report?
Introduction: In this comprehensive guide, we will walk you through the account overlap report process. Let's dive into the step-by-step process. Navigating to Account Overlap report: Click on Reports> Account Overlap Reports ...How do I access landing page reports?
Note: On the Bridge platform, clients can personalize menu navigation to better suit the specific needs of their Users. As a result, menu navigation may vary. If you are unable to navigate to the correct page, contact your platform administrator. Go ...