How do I export an asset report?
Posted by The Team at Mindmatrix on 29 April 2016 01:31 PM  Note: Things may be under a different part of your navigation bar depending on your settings and customization. Contact your Support team or Consultant for further assistance if you can’t find the selection noted. | |
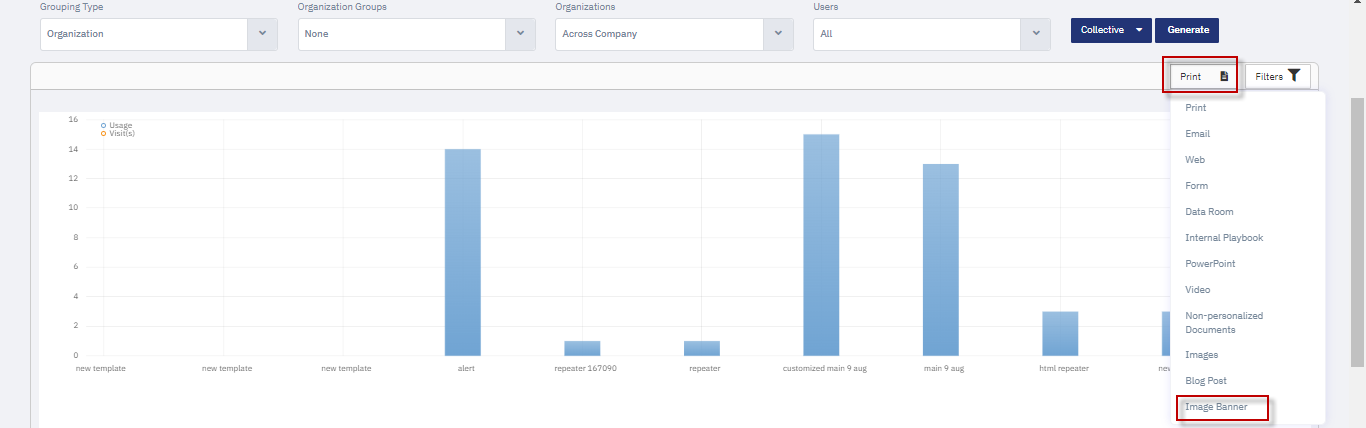
To export an item from the Asset Report to your hard drive, first, go to the "Reports" section and then select the "Asset Report". The select the report that you would like to export.
Finally click on the export icon. New Image Banner Report Feature Added to Asset Reports We've enhanced our Asset Report functionality by adding a dedicated report for image banners. This new feature allows you to export and analyze detailed information about all image banners created within your account. Here's what you need to know:
This new report empowers you to better understand the effectiveness and usage of your image banners, allowing for more informed decision-making in your asset management strategy. Enhanced Data Display in Asset Reports
A new enhancement has been added to the Asset Report section for Videos, Images, and Non-Personalized Documents, improving how statistical data is displayed and exported. Key Changes: In-Portal Display: On the Asset Report page, under the columns Sent, Opened, and External Views, statistics now display two values in a single column format, such as 2 (5), where:
Export Functionality: When these reports are exported, the data is presented with separate column names for each metric, providing a clear and detailed breakdown of all statistics. Benefits:
How It Works: Portal View:
Export View:
Use Cases:
Conclusion: This enhancement optimizes the asset reporting experience by providing summarized data for quick portal viewing while ensuring detailed analytics are available in exported reports. Users benefit from space-efficient portal displays for monitoring and comprehensive separated data columns for in-depth analysis, making asset performance tracking both convenient and thorough across different use cases and reporting needs. | |
Related Articles
How do I view reports on my drip email campaigns?
It is possible to personalize navigation menus within Mindmatrix software. If you are unable to navigate to the correct page, contact your platform administrator. There are three ways to access the reports on your drip email campaigns. The most ...How do I access the Asset Template gallery?
As an MSP Advantage, MarketNow Concierge or IT Advantage client, you have access to pre-created content in your account that you can customize on your own, or work with support to utilize. This article details how you can find these ready-made assets ...How do I export the Filter Management report?
The filter management report can used to export the usage of assets assigned with a particular filter. Navigate to Setup > Asset Management > Filter Management > Filter Management Click on the count under the "Assigned Assets Used" or "Usage" column ...How do I View My Asset Library?
Your asset library contains many pre-constructed content packs ranging from Emails to Blog Posts to Playbooks to help enable your sales and marketing teams. You also have the ability to create and upload your own content that can be used within the ...How do I view the Report for Blog template?
A new enhancement has been made to the Asset Report for blog posts, aimed at improving the reporting functionality and providing more detailed insights. The update introduces several changes to how blog posts are tracked and reported, offering users ...