How do I view a social media drip report?
 It is possible to personalize navigation menus within Mindmatrix software. If you are unable to navigate to the correct page, contact your platform administrator.
Note: Social media reporting in one account cannot be viewed by other accounts. These reports are unique to your user account.
“Drip Campaign” will show you all current social drip campaigns that are running. Here you will be able to see how many campaigns are running under each user and the status of each drip.

Instructions:
Go to Reports > Campaign Reports > Social Drip Reports
A window will open showing the bar graph displaying the values of the Total, completed, running, stopped, and scheduled drips.
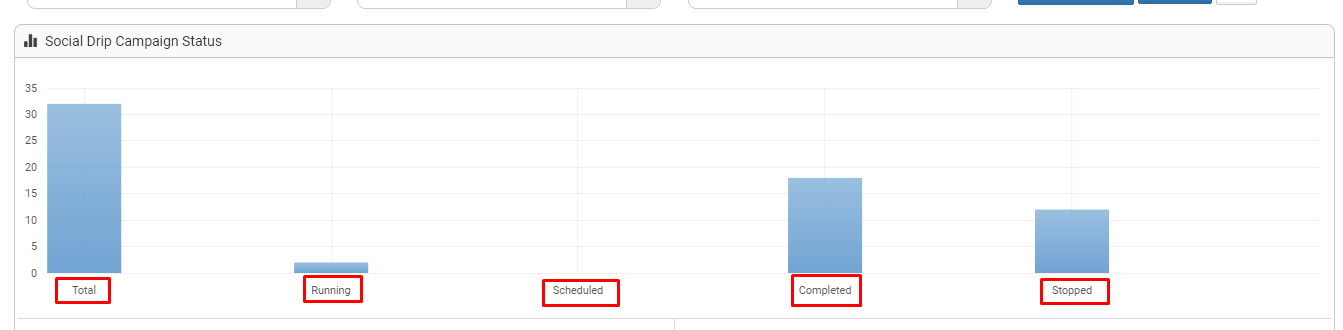
You can generate the report on the basis of a specific time period by clicking the “Collective” option.

Total - Total number of social drips in your account.
Running - Total number of running drips under all the users of your company.
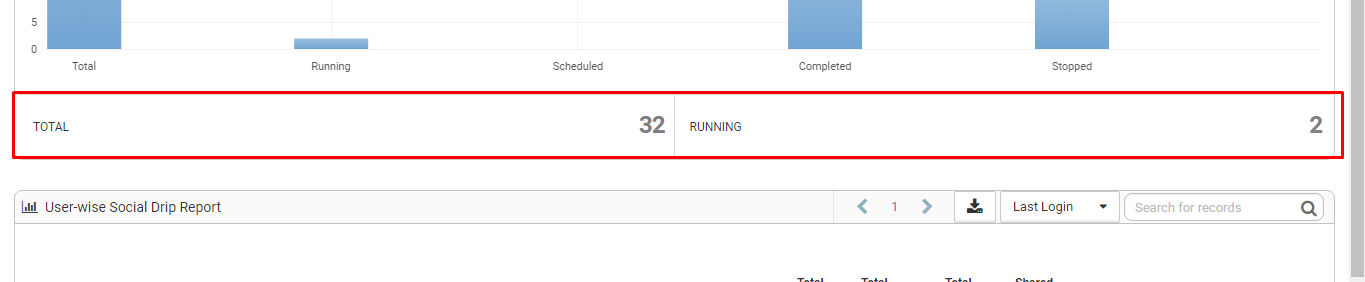
In this section, scroll to User-Wise Social Drip Report > To view a specific social media drip report of the user.

Total Likes - The number of likes of your post
Total Comments - The number of comments of your post
Total Shares - The number of shares of your post