How do I view the Report for Blog template?
A new enhancement has been made to the Asset Report for blog posts, aimed at improving the reporting functionality and providing more detailed insights. The update introduces several changes to how blog posts are tracked and reported, offering users a more comprehensive view of engagement metrics. Below are the key updates-
Here are the steps you need to follow:
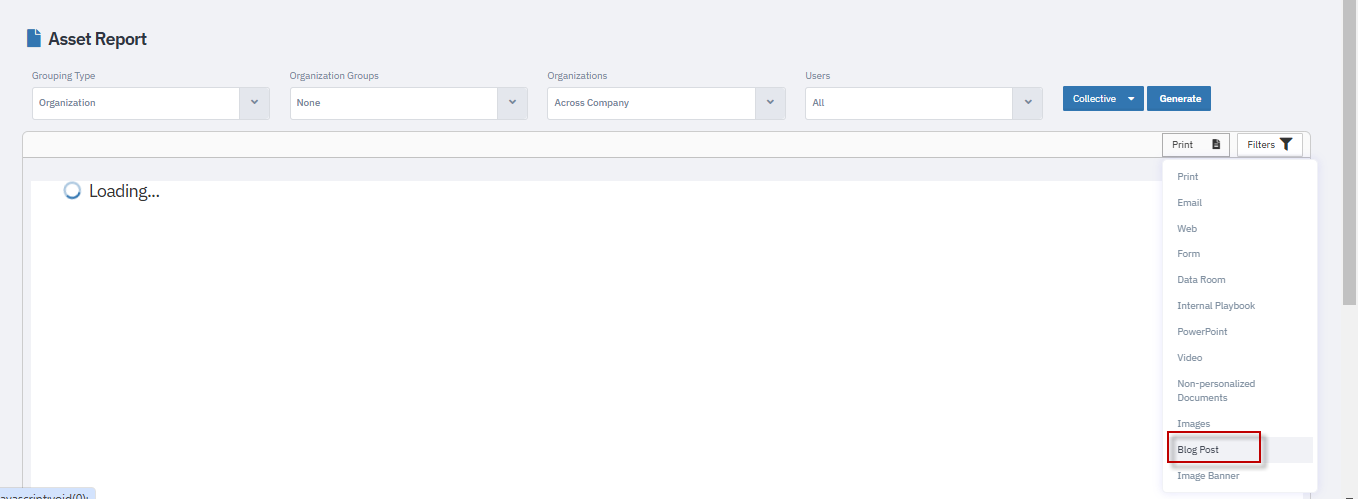
To check the blog reporting, navigate to Report > Asset Report. Once you are on this page, select the blog option from the dropdown.
New Reporting Structure
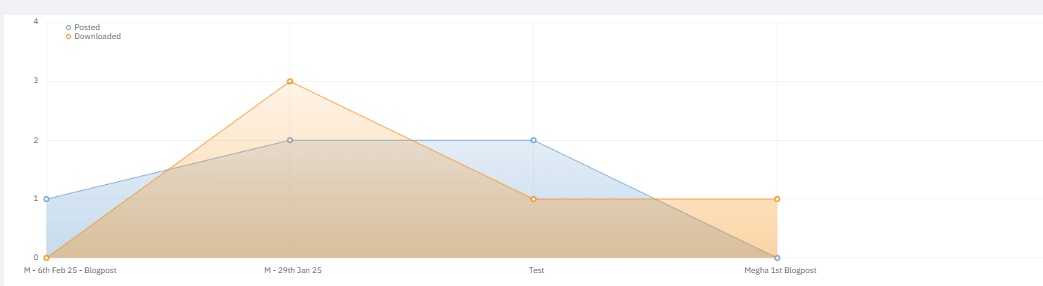
Previously, the Asset Report for blog posts displayed a bar chart. With this enhancement, a line chart has been implemented to track various metrics related to blog post interactions. The line chart now displays two additional columns:
Internal Views
Posted
These columns, displayed in gray, allow users to see the engagement levels for both internal views and posts separately.

Action Tracking
The following features are available in the updated report:
- Blog posts are tracked based on the status of three actions: posted, downloaded, and internal views.
- A blog template that has not been downloaded or posted will show a usage count of 0.
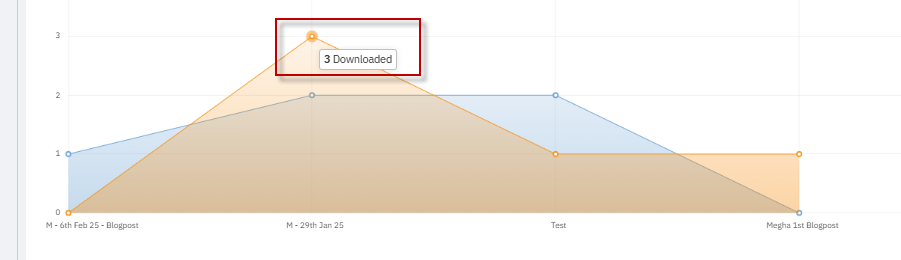
- Once a blog post is posted, the posted count will increase and be visually represented in blue, while the downloaded count will appear in orange.

User Engagement Details
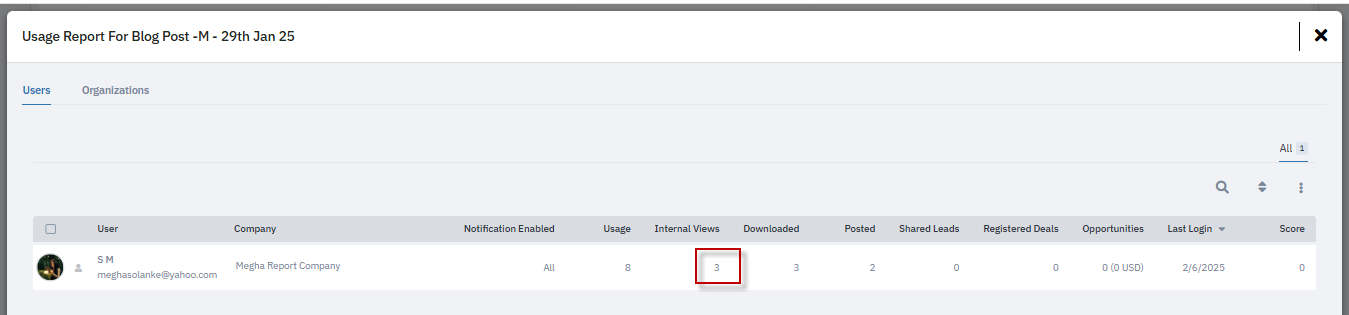
The report provides detailed information about user engagement. If multiple users are interacting with the blog post, the report will list each individual user who has either downloaded, viewed, or posted the content. This allows for a more granular understanding of who is engaging with each post.

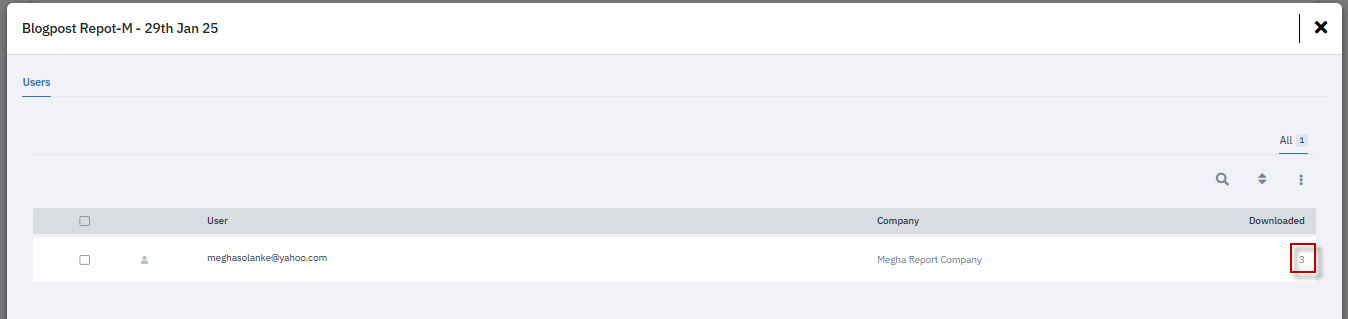
The enhanced Asset Report now includes the option to export the report data. This feature allows users to generate detailed reports containing the number of users who have downloaded or interacted with the blog post. This can be particularly useful for tracking engagement over time or sharing performance metrics with teams.

This enhancement provides more robust tracking and reporting capabilities for blog post interactions, enabling users to monitor engagement and optimize content strategies more effectively.