How do I View User Reports?
Enhanced User Reports with New "Based on" Filtering Option
We've improved the Users Reports page by adding a new "Based on" dropdown field, offering more flexibility in how you view and analyze user data. Here's what you need to know:
New Feature: "Based on" dropdown field added to the Users Reports page
Purpose: Allows for more specific sorting and filtering of user reports
How to Use:
Navigate to the Users Reports page
Locate the new "Based on" dropdown field
Select your desired sorting criteria
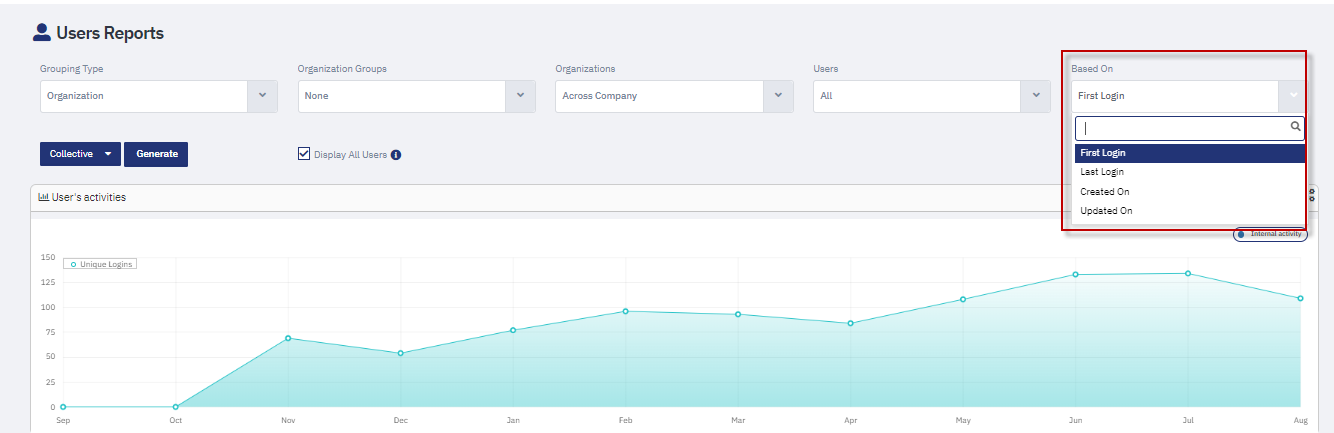
Available Sorting Options:
First Login: Sort users based on their initial login date
Last Login: Organize users by their most recent login
Created On: Sort by the date user accounts were created
Updated On: Arrange users based on when their accounts were last updated
Benefits:
More tailored analysis of user activity
Ability to quickly identify new, active, or potentially inactive users
Enhanced insights into user account lifecycle
Improved decision-making for user management and engagement strategies
Use Cases:
Identify recently onboarded users (First Login)
Track user engagement patterns (Last Login)
Monitor account creation trends (Created On)
Keep track of account modifications (Updated On)
This new filtering capability provides a powerful tool for understanding user behavior, optimizing onboarding processes, and maintaining an active user base.
New Filter Option in User Reports
A Filter option has now been added to the User Reports page for improved user data navigation.
How It Works:
Click on the Filter icon on the User Reports page
Select the desired filter to quickly search and locate users matching the selected criteria

Benefits:
Faster Data Access: Quickly narrow down large user report datasets
Targeted Analysis: Focus on specific user groups for more relevant reporting
Improved Efficiency: Reduce time spent searching through extensive user lists
This enhancement enables faster and more targeted access to user report data.

Overview
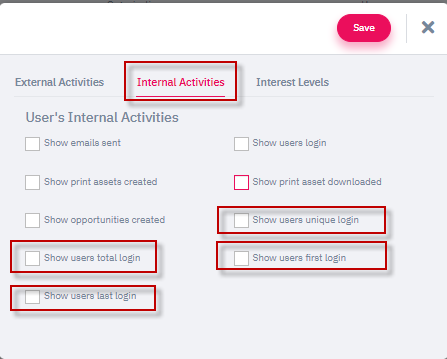
Two new checkboxes—Created On and TOS Accepted—have been added to the User’s Activities Graph Report under the Internal Activities settings.
How It Works
Access the User Report
Go to Reports > User Report.
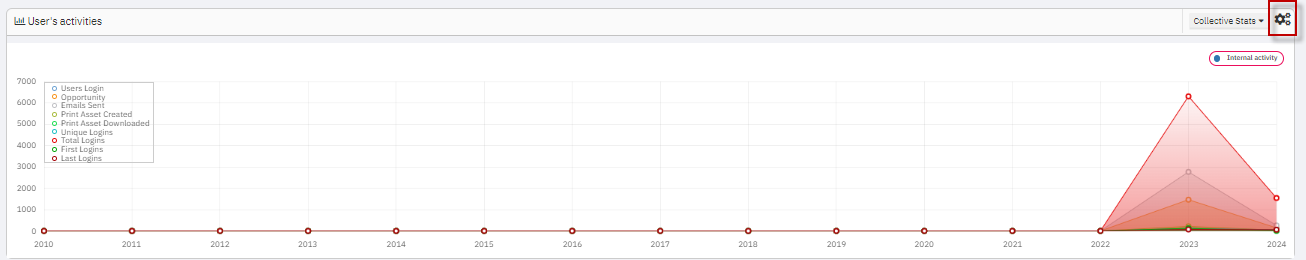
Open the User’s Activities graph.

Enable ‘Created On’ or ‘TOS Accepted’
In the Settings (under Internal Activities), check the boxes for:
Created On: Tracks the date a user account was created.


Filter by Date
Use Daily, Weekly, Monthly, or Collective filters to view the data in different time intervals.

Benefit
Detailed Onboarding Insights: Quickly see how many new users were created or accepted TOS in a given period.
Better Compliance Tracking: Monitor TOS acceptance rates over time.
This enhancement allows for more comprehensive tracking of user activity and engagement over time.
How to View Incentives Data in the User Report
Overview
An enhancement now adds visibility into Incentive Module statistics within the User Report. If your organization has the Incentives Module enabled, you can now track individual user performance related to incentive earning, redemption, and balance—directly from the reporting dashboard.
New Fields Added to the User Report
These incentive-related fields have been added:
Earned Incentives
Total rewards or points earned by the user.Redeemed Incentives
Rewards or points that the user has used.Balance Incentives
The remaining, unredeemed incentive points the user currently holds.

Where to Find This Information
Go to: Reports > User Report
Open or filter user records as needed.
The above incentive columns will appear alongside other user performance metrics.


Additionally, these fields are now included in the Filter dropdown, allowing you to:
Filter users based on a specific incentive range.
Combine incentive filters with other performance metrics.
Use Cases
Monitor Program Engagement: Easily identify which users are participating actively in incentive programs.
Track Reward Utilization: See how many rewards have been redeemed and what’s outstanding.
Target Top Performers: Use incentive data to reward or further engage high-performing users.
 Benefits
Actionable Insights: Quickly spot users who are engaging with your incentive structure.
Better Program Management: Understand which parts of your incentive model are effective.
Improved User Segmentation: Filter users for email campaigns or automation based on incentive status.

Summary
This update provides a powerful way to monitor how users are engaging with your organization’s incentive programs. By surfacing earned, redeemed, and remaining incentives within the User Report—and making them filterable—you can make smarter, data-driven decisions to boost user motivation and program success.
Related Articles
How do I view reports for a print template?
From the Print Template gallery, select the template that you wish to view a report on. From the "More" dropdown menu, select "Report" The “Stats and Activities” graph will show the total number of times a user used a template. The “Usage Ratio” ...How do I view account based reports?
The Accounts report page refers to the organizes your contacts according to their company or corporate affiliation and provides overall metrics for each Account entity. To view a summary of your accounts’ activity, go to Reports > Connections > ...How do I view reports on my drip email campaigns?
It is possible to personalize navigation menus within Mindmatrix software. If you are unable to navigate to the correct page, contact your platform administrator. There are three ways to access the reports on your drip email campaigns. The most ...How do I implement graph reports for User and Organization Lists?
Introduction: Learn how you can save historical data related touser and organization smart lists, and use them to generate dynamic graphs. In this guide, we will walk you through the process of creating smart lists and presenting them in a visual ...How do I use the Users Report page?
The users report records the internal activity of users within the platform as well as the activities of users as they engage with emails you send or collateral or tracked sites you own. Use the user engagement report to drill down on the activities ...