How do I view opportunity reports?
1. To view your report, hover over "Reports" then click "Opportunities Reports".
2. You can narrow the results by choosing any of the following drop downs such as selecting an opportunity, then click "Generate".
3. Aggregate Opportunity Activity gives date wise report of Opportunities based on the date when the status was changed. This can be sorted based on Daily, Weekly or Monthly stats.
4. Won Opportunity Report gives a donut chart for "won details" to such as won due to "Price" or "Competition" and the breakdown of the "Market" for all Closed-Won Opportunities.
5. Lost Opportunity Report shows a chart for "won details" such as won due to "Price" or "Competition" and the breakdown of the "Market" for all Closed-Lost Opportunities.
6. Opportunity Report provides a bar chart of value for each status of Opportunities.
7. Market Report demonstrates all Opportunities with Market field updated for opportunities recorded.
Market Report - By Market shows a chart for "Market" value for all Opportunities.
Market Report - By Won shows a chart for "Market" value for all Closed-Won.
Market Report - By Loss shows a chart for "Market" value for all Closed-Loss.
Market Report - Velocity: Won shows a chart for "Market" value for all Closed-Won Opportunities with Velocity which is the number of days taken to close the Opportunity
Market Report - Velocity: Loss - gives donut chart breakdown for "Market" value for all Closed-Loss Opportunities with Velocity which is the number of days taken to close the Opportunity.
Market Report - By Value provides a chart for the breakdown of "Market" value for all Opportunities and the amount associated with each market.
8. Need Help For Sales is the list of users who have lost max number opportunities (maximum 10 Users).
9. Need Help For Marketing is the list of users who have the minimum number of opportunities created or owned (maximum 10 Users).
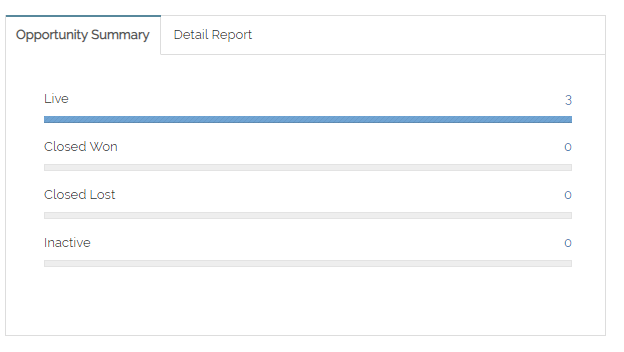
10. The Opportunity Summary chart on the right hand summarizes opportunities by status: "Live", "Closed Won", "Closed Lost" and "Inactive".
11. The detail report shows the Closed Won to Closed Lost ratio at a glance.
12. Finally, at the bottom of the report, you can also sort by Opportunity status.
Related Articles
How do I review reports on opportunities?
It is possible to personalize navigation menus within Mindmatrix software. If you are unable to navigate to the correct page, contact your platform administrator. Who would use this? Users that would like view reports about the Opportunities they ...How do I view reports for a print template?
From the Print Template gallery, select the template that you wish to view a report on. From the "More" dropdown menu, select "Report" The “Stats and Activities” graph will show the total number of times a user used a template. The “Usage Ratio” ...How do I submit a (Standard Layout) Opportunity record?
If you, (or your Users, if you are in charge of a Channel) aren't seeing an Opportunities option, make sure the Role has the appropriate Opportunity permissions. Admins can slide the Opportunity feature to the create/own/delete level. You can email ...How do I View User Reports?
To view user reports, go to Reports > Users. This section also allows admins to see summary stats for each User entry, such as the number of contacts a user has reached out to, how many assets a user has created, or how many times a contact has ...How do I view account based reports?
The Accounts report page refers to the organizes your contacts according to their company or corporate affiliation and provides overall metrics for each Account entity. To view a summary of your accounts’ activity, go to Reports > Connections > ...